Plone Performance Troubleshooting: ContextState.actions()
Background
One of our Plone sites has always given us performance problems, since it's the largest of our sites (57,000 objects in the catalog) and receives the most traffic (around 3.6 million visits a year.)
Initial Performance Testing
To determine if one of our many customizations was causing performance issues, I ran a few tests with the Apache HTTP server benchmarking tool (ab) to see how many Requests per second the site was returning.
ab -n 25 -c 2 [url]
and it averaged out to around 3.5 requests per second.
Without Viewlets
That's not terrible, but I wanted to see how much our viewlet customizations were affecting performance, so I blanked out our browser/configure.zcml file. On re-running the ab tests, the throughput jumped to around 8 requests per second.
Wow!
Troubleshooting
I tried to eliminate obvious viewlet candidates, with no success. So, I figured I would approach it in a systematic way by removing one viewlet at a time, and re-running the performance tests.
I'm sure there was an easier way to do this through Plone by turning off viewlets (as in @@manage-viewlets) but at the time, it seemed more efficient to brute-force the testing rather than spend time finding a clever way.
Disclaimer
This is not a "how-to", rather a "how-did". I'm not recommending this approach to testing, but it seems to have worked in this case.
Test Scripts
I created a bash control script that would:
- remove one <browser:viewlet /> configuration at a time from browser/configure.zcml
- restart Zope
- run an ab test against it to ensure everything's loaded
- run three ab tests for the record, saved under the name of the viewlet that was removed
#!/bin/bash

cp ORIG-configure.zcml configure.zcml
OUTPUT=output
URL="[URL to test goes here]"
CMD="ab -n 25 -c 2 $URL"

while [[ True ]]
do
    VIEWLET=`./remove_viewlet.py`
    echo $VIEWLET $ZOPE
    if [[ $VIEWLET = "NO_NAME" ]]
    then
        echo "Done!"
        break
    fi
    if [[ ! -f $OUTPUT/$VIEWLET.3 ]]
    then
        echo Stopping for $VIEWLET
        sudo $ZOPE/bin/client1 stop
        sleep 5
        echo Starting for $VIEWLET
        sudo $ZOPE/bin/client1 start
        sleep 15
        echo Waiting for $VIEWLET
        X=`$CMD`
        $CMD | grep "Requests per second"
        for SEQ in `seq 1 3`
        do
            echo Running $VIEWLET test $SEQ
            $CMD > $OUTPUT/$VIEWLET.$SEQ
        done
    fi

done
The remove_viewlets.py script is a small bit of Python (using BeautifulSoup) that:
- removes the first <browser:viewlet /> configuration in browser/configure.zcml
- outputs the remaining ZCML back to the file
- returns the name attribute of the viewlet removed
#!/usr/bin/python

from BeautifulSoup import BeautifulStoneSoup

# BeautifulSoup requires self-closing tags be explicitly declared
selfClosingTags = [x.lower() for x in ['interface',
                                       'browser:page',
                                       'browser:viewlet',
                                       'five:implements',
                                       'include',
                                       'plone:portletRenderer',
                                       'browser:menuItem']]

# Read configure.zcml
soup = BeautifulStoneSoup(open("configure.zcml", "r"),
                         selfClosingTags=selfClosingTags)

# Set default name value
name = "NO_NAME"

# Remove first instance of browser:viewlet and grab name.
for v in soup.findAll("browser:viewlet"):
    name = v.get("name")
    v.extract()
    break

# Format XML
pretty = soup.prettify()

# ZCML is apparently case-sensitive
for c in """
browser:menuItem
plone:portletRenderer
""".strip().split():
    pretty = pretty.replace(c.lower(), c)

# Output remaining ZCML
open("configure.zcml", "w").write(pretty)

# Return name
print name
Results
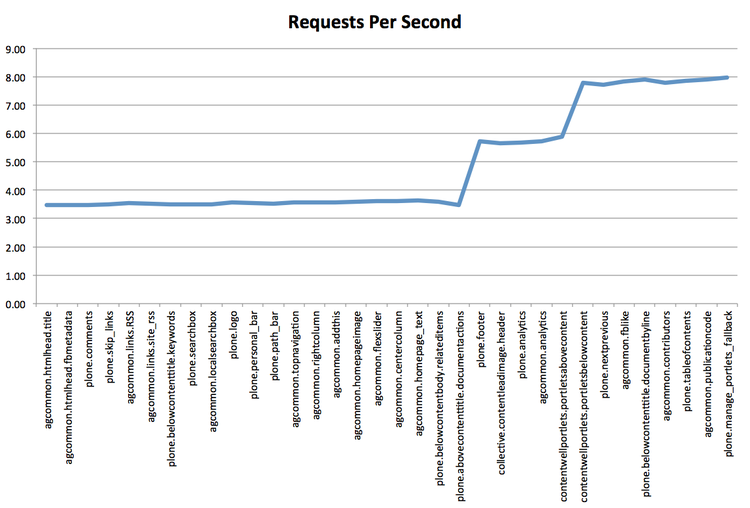
After running this script (total time: 45 minutes) and graphing the Requests per Second, I found that we had two definite spikes that would appear to indicate performance bottlenecks.

Identifying the Problem Code
I now had a clear indication that the plone.footer viewlet was "apparently" contributing to the slow performance. Although we don't do anything particularly intensive in the footer, removing that viewlet seemed a good first test.
And, it resulted in absolutely no change to the 3.5 requests per second throughput.
Next, I worked backwards (manually) from plone.footer in browser/configure.zcml, removing approximately three viewlets at a time. After a few iterations, the throughput jumped from the current 3.5 to around 5.7 requests per second.
It appeared that a combination of viewlets was causing the performance issues, which is a strange situation indeed!
I tracked it down to a mistake on my part when accessing data in the portal_actions tool. I had found (or modified) this bit of code somewhere:
self.context_state.actions().get('value', None)
and used it in various places within our product.
We use portal_actions extensively to store many types of data (links for social media portlets, buttons, top navigation items) and the number of "folders" had grown to 368, each with one or more "items" inside.
The code above aggregates the entire contents of portal_actions into one huge data structure, which I was using to "get" the value of a single "folder" to use on the page. With that much data, this was very resource intensive.
The reason I had to disable multiple viewlets to see any effect was that the results from calling the actions() method seem to be cached. So the performance hit occurred if I called it once, but didn't get any worse if I called it multiple times.
Solution
After some digging, I found this helpful message (and option) in plone/app/layout/globals/context.py:
if category is None:
    warnings.warn("The actions method of the context state view was "
        "called without a category argument. This is deprecated and "
        "won't be supported anymore in Plone 5.",
        DeprecationWarning, 3)
which led me to discover the category argument to the actions() method.
So, changing all of the instances of the actions().get() call to:
self.context_state.actions(category='value')
resulted in a 48% improvement in the number of requests per second.
The Second Bottleneck
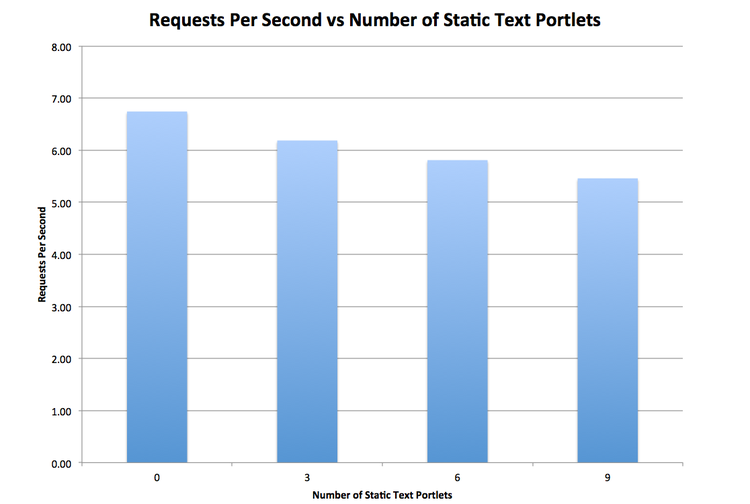
The second bottleneck appears to be caused by the presence of six static text portlets in our footer (using Products.ContentWellPortlets) as a sitemap. These were originally collection portlets, and I had converted them to individual static text portlets to avoid making six additional catalog queries.
As a separate test, I ran ab against a site using 0, 3, 6, and 9 static text portlets and saw the following:

So, there does appear to be an inverse correlation between including individual portlets (even if they're just static text) and the number of requests per second.
Since these don't change often, I grabbed the raw sitemap HTML (using Firebug) and added it directly to the template in portal_view_customizations. Whenever we need to update those portlets, we can just remove the customized version, re-copy the generated HTML, and re-customize.
Conclusions
After going through this exercise, I think the takeaways are:
- Large catalogs make for slow performance. (See: Advice for site with very large number of objects (millions).)
- Something very little (passing the "category" parameter) can make a large difference.
- Reading the source code is a huge help (yay, open source!)
- Applying a systematic approach to performance troubleshooting (also including profiling at the Python level) helps identify problems.
- Automating the "disable viewlet/run ab" approach through Plone rather than restarting for each viewlet could save a bunch of time!
